September 12, 2026
TCO of an enterprise integration: how to calculate maintenance, errors, support and technical debt
How to calculate the total cost of ownership of an integration: implementation, maintenance, support, errors, technical debt and third-party dependence.
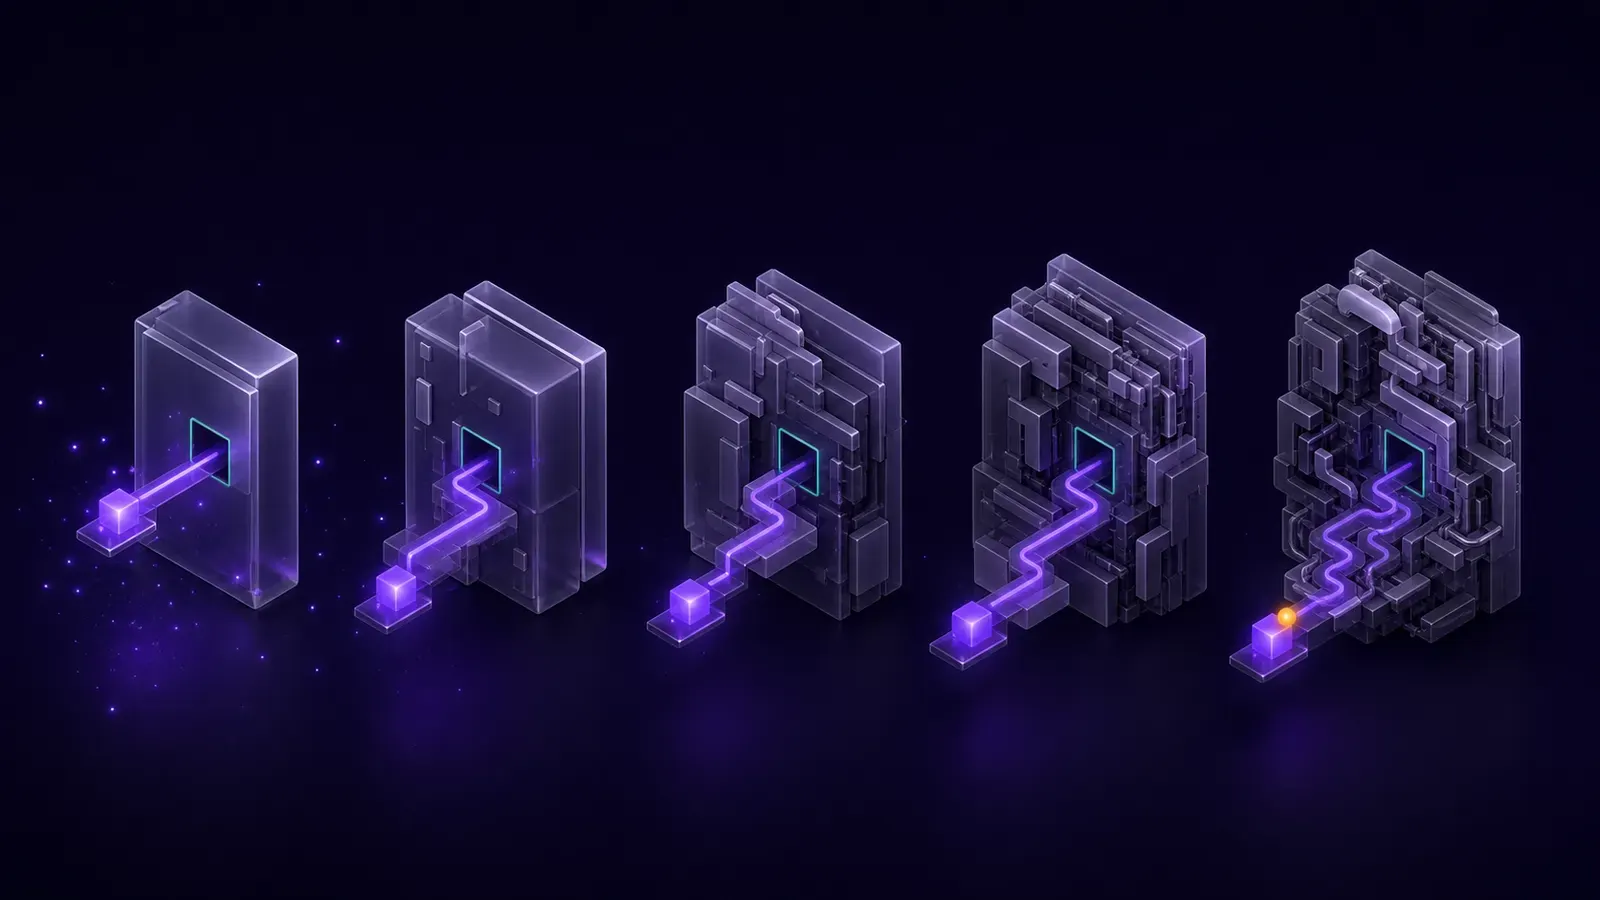
The price of an integration, what it costs to implement, is barely a part of what it costs to keep it running for years. The total cost of ownership, or TCO, also includes maintenance, support, the time lost resolving errors and the technical debt that accumulates when an integration is patched instead of redesigned.
This guide explains how to calculate the TCO of an enterprise integration completely, with a method you can apply in an afternoon, so the comparison between alternatives, including the alternative of changing nothing, is realistic.
Quick summary
- Implementation cost is usually the smallest part of the total cost over three years.
- The components most often left out are rework from errors and dependence on a single person or supplier.
- Technical debt can be measured indirectly: how long a simple change takes today compared with before.
- Every comparison has to include the cost of doing nothing, which is rarely zero.
Why the initial cost does not represent the real cost
It is common to compare integration alternatives by looking only at the implementation cost. But an integration that is cheap to implement and expensive to maintain can end up costing more over three years than an alternative with a higher initial investment and a lower operating cost.
There is an asymmetry that explains the bias: implementation cost is visible, it has an invoice and it appears in the project budget. Maintenance, error and rework costs are distributed across several teams, logged as normal working hours and never consolidated into a single number. They are there, but nobody adds them up. The same happens with low-cost connectors, as we show in our analysis of the hidden costs of middleware: the licence price is the only thing that shows up on the invoice.
Components the calculation has to include
| Component | What it includes | How to estimate it |
|---|---|---|
| Implementation | Development, configuration, licences, training | Project budget |
| Maintenance | Adjustments for version or API changes in the connected systems | Last year’s hours × hourly cost |
| Support | Incident resolution, internal and external | Incidents × average time × cost |
| Errors and rework | Correcting badly processed orders, stock and invoicing | Incidents × correction time |
| Technical debt | Growing extra cost of each change | Comparison of change times |
| Third-party dependence | Risk and cost of depending on one person or supplier | Cost of replacement or of stoppage |
| Opportunity cost | Projects not done for lack of capacity | Prioritised qualitative estimate |
| Infrastructure | Servers, monitoring, log storage | Monthly cost × period |
How to estimate each component in practice
Maintenance and support. These are estimated from the hours the team spent on these tasks over recent months, multiplied by the hourly cost. The most reliable source is not the team’s memory, but the ticketing system or the incident log, if one exists.
Errors and rework. Identify how many incidents were generated by integration failures and how long each one took to resolve. It is worth including the time of everyone involved: whoever detected the error, whoever diagnosed it, whoever fixed it and whoever attended to the affected customer. That last one is usually left out and is often the largest.
Technical debt. It is the hardest to quantify, but it allows a useful approximation: measure how long it takes today to implement a simple change, adding a field, adding a branch, connecting a system, compared with how long it used to take. If that time grows with each change, technical debt is growing, and its cost is the accumulated difference.
Third-party dependence. The cost is estimated as the risk of unavailability: what would happen if that person or supplier stopped being available tomorrow, how long it would take to replace them, and what stops in the meantime.
Opportunity cost. It is the component hardest to defend to a CFO and often the largest: the projects that were not done because the team was busy maintaining fragile integrations. It is best presented as a concrete list of postponed initiatives, not as a number.
An example of a three-year calculation structure
The values depend on each operation; what carries over is the method. For each alternative under evaluation, including keeping the current setup, it is worth building this table:
| Year | Implementation | Maintenance | Support | Errors | Infrastructure | Total |
|---|---|---|---|---|---|---|
| 1 | Initial investment | Partial | Partial | Current or improved level | Monthly × 12 | Sum |
| 2 | — | Full year | Full year | Expected level | Monthly × 12 | Sum |
| 3 | — | Annual + debt | Full year | Expected level | Monthly × 12 | Sum |
Two observations that appear almost every time it is completed:
- In the “change nothing” scenario, maintenance and errors do not stay constant: they grow, because volume grows and so does technical debt.
- The cheapest alternative in year 1 is rarely the cheapest over the three-year total.
Why this calculation matters to different executive profiles
TCO connects with the priorities of three different profiles, and that is why it works so well as an argument:
- CFO: the real cost of a technology decision and its impact on cash flow over three years.
- CTO: technical debt, operational risk and the team’s capacity to do other things.
- COO: the impact of errors on daily operations and on customer experience.
Presenting the full TCO, and not just the implementation cost, is usually the argument that turns an integration project from IT spend into a business decision. Its natural complement is the ROI calculation: TCO shows the true cost, ROI shows the return.
Frequently asked questions
Over how many years should TCO be calculated? Three years is the most common horizon and is usually enough for the differences between alternatives to become obvious. Five years gives a fuller picture but brings in a lot of uncertainty about volumes and systems.
How do I include the internal team’s cost if they are already on payroll? At their loaded hourly cost. The argument that “it is already paid for” ignores that this time has an alternative use: if the team were not maintaining integrations, they would be doing something else of value to the business.
Does a platform’s TCO include only the licence? No. It includes licence or subscription, implementation, training, flow maintenance, support and the associated infrastructure. A platform reduces several of those components, but does not eliminate them. That is why it pays to compare complete models rather than list prices: our comparison of what MuleSoft costs versus Weavee shows how the licensing model, the team you need and who maintains the flows differ.
How do I compare TCO with the option of doing nothing? By calculating the TCO of the current scenario with the same methodology and projecting it with the expected volume growth. It is the most underestimated scenario, because its cost is distributed and taken for granted.
What do I do if I have no historical incident data? Start recording it now, even simply, and use the team’s estimate in the meantime. An approximate, documented number is far more useful for deciding than no number at all.
Checklist to calculate your integration’s TCO
- Was the maintenance cost included, estimated in team hours at loaded cost?
- Was the time spent resolving integration errors over recent months quantified, including customer support?
- Was the cost of depending on a single person or supplier considered?
- Was it estimated how the cost of a simple change grows over time?
- Were infrastructure, monitoring and log storage included?
- Was the TCO of the change-nothing scenario also calculated?
- Does the comparison cover the next 2 or 3 years, not just the first year?
You may also be interested in reading:
• “From CSV and Excel to real-time data: when a manual integration becomes an operational risk” • “ROI of integrating systems: how to estimate operational savings, error reduction and implementation speed” Weavee helps calculate the real TCO of your current integrations, including maintenance, errors and technical debt, to compare objectively against a centralised architecture. On the platform side, Weavee’s plans and pricing are set by the entities processed per month and the support hours you need, so that component can be projected over three years with your own volume.